
Introduction
Sales pipeline coverage stands as a foundational metric that reveals whether your team carries enough opportunity value to hit revenue targets. Yet most organizations measure it incorrectly, creating either false confidence or missed quotas. According to recent research, 81% of B2B companies missed a quarterly forecast in the last two years, often due to pipeline measurement errors rather than execution gaps.
The typical culprit? Relying on a generic 3x coverage ratio without adjusting for win rates, deal velocity, or stage distribution. Teams treat all opportunities as equally likely to close, ignore stale deals that inflate the number, and apply flat benchmarks across reps with completely different performance profiles.
This guide covers how to calculate pipeline coverage accurately, spot the errors that corrupt the number, and pair it with complementary metrics, so you forecast with confidence instead of guesswork.
Key Takeaways
- Pipeline coverage = Total Pipeline Value ÷ Sales Target; the typical benchmark is 3x–5x, but it varies by win rate and sales cycle
- Weighted pipeline coverage (using stage probabilities) gives a more reliable read than the basic ratio alone
- Low coverage (under 2x) signals a pipeline generation problem; high coverage doesn't mean safety if the pipeline is bloated with stale deals
- Pair coverage with win rate, deal velocity, and stage progression for reliable forecasting, no single metric tells the full story
- Clean CRM data and clearly defined close periods are required, without them, your coverage ratio measures noise, not reality
What Is Sales Pipeline Coverage?
Pipeline coverage is the ratio between the total value of open opportunities expected to close in a given period and the sales target for that same period. It answers one fundamental question: Do we have enough in the pipeline to hit our number?
Track Coverage at Three Levels:
- Individual rep: Accountability and coaching
- Team or segment: Resource planning and territory management
- Company-wide: Executive alignment on pipeline generation needed to meet revenue goals
Why It Matters in B2B Sales
B2B sales environments deal with longer cycles, multi-stakeholder decisions, and higher deal slippage than transactional sales, all of which make accurate pipeline visibility a prerequisite for reliable forecasting. According to Gartner, executives consistently report that pipeline management and sales forecasting are among the areas where sales operations functions are least effective.
Better coverage tracking directly improves forecast accuracy. A Forrester Total Economic Impact study found that organizations using revenue operations platforms improved forecast accuracy from more than 10% off the mark to closer than 5%. The stakes are real: in a 2024 Revenue Leak Report, 57% of RevOps leaders cited slipped deals as a major cause of revenue leak.
How to Calculate Sales Pipeline Coverage
Two methods exist for calculating pipeline coverage: the basic unweighted ratio and weighted pipeline coverage using stage probabilities. Choosing the right method depends on how much confidence and granularity you need.
Prerequisites for any method:
- Clean CRM with accurate opportunity values
- Defined close dates for each opportunity
- Clearly set quota or target for the period
Method 1: Basic Pipeline Coverage Ratio
This method compares the raw total value of all open opportunities expected to close in a period against the sales target. It delivers a quick top-line read.
Formula:
Pipeline Coverage = Total Pipeline Value ÷ Sales Target
Example:
$900K pipeline ÷ $300K target = 3x coverage
Step-by-Step:
- Define the time period (month or quarter) and confirm the quota or revenue target for that window
- Pull all open opportunities with expected close dates within that period from your CRM; sum their total value
- Divide total pipeline value by the target to get the coverage ratio
Pros:
- Quick and easy to calculate
- Useful for executive snapshots and top-of-quarter planning
- Provides directional guidance at the start of a period
That said, it has real limits mid-period.
Cons:
- Treats every deal as equally likely to close
- Ignores stage, deal age, and qualification quality
- Becomes less meaningful as deals progress or slip
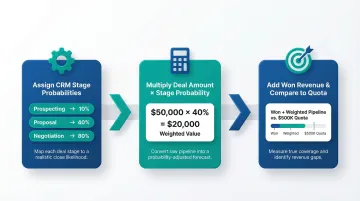
Method 2: Weighted Pipeline Coverage (Expected Revenue)
This method assigns a close probability to each opportunity based on its pipeline stage, then sums the weighted values alongside won deals to calculate Expected Revenue, a more reliable estimate of what will actually close.
Formula:
Weighted Opportunity Value = Deal Amount × Stage Probability
Expected Revenue = Sum of Won Deals + Sum of Weighted Pipeline Values
Then compare Expected Revenue to your quota to assess true coverage.
Step-by-Step:
- Ensure your CRM pipeline stages have accurate probability percentages assigned (e.g., Prospecting = 10%, Proposal = 40%, Negotiation = 80%), verify these reflect actual historical win rates, not system defaults
- For each open opportunity, multiply the deal amount by its stage probability to calculate the weighted value; sum all weighted values across the pipeline
- Add the total weighted pipeline to already-won revenue for the period; compare that Expected Revenue figure to the quota
Example:
| Deal | Amount | Stage | Probability | Weighted Value |
|---|---|---|---|---|
| Deal A | $100K | Prospecting | 10% | $10K |
| Deal B | $80K | Proposal | 40% | $32K |
| Deal C | $60K | Negotiation | 80% | $48K |
Total weighted pipeline = $90K. If quota is $300K and already-won deals total $150K, Expected Revenue = $150K + $90K = $240K. Coverage against remaining quota of $150K = $90K ÷ $150K = 0.6x, a clear risk signal.
Pros:
- Accounts for deal stage and likelihood of closing
- Handles deal type differences (new vs. existing customers, product lines, territories)
- Useful at any point in the period, not just at the start
The tradeoff is that it demands more from your CRM.
Cons:
- Depends entirely on probability values being accurate and current
- Requires rigorous CRM hygiene and well-defined stage thresholds
How to Interpret Your Pipeline Coverage Results
A coverage number without context is almost meaningless. Win rate, sales cycle length, deal type, and where you are in the quarter all determine what the ratio actually signals for your team's likelihood of hitting quota.
Healthy/On-Track Coverage
Industry benchmarks vary by sales segment:
| Sales Segment | Typical Coverage Ratio |
|---|---|
| Enterprise | 3x–5x |
| Mid-Market | 2.5x–4x |
| SMB | 2x–3x |
Benchmarks give you a starting point, but your team's actual win rate determines what "healthy" really means. The formula is straightforward: Required Coverage = 1 ÷ Win Rate.
| Historical Win Rate | Required Pipeline Coverage |
|---|---|
| 50% | 2x minimum |
| 33% | 3x minimum |
| 25% | 4x minimum |
| 20% | 5x minimum |
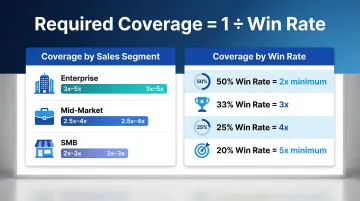
A team closing 25% of deals needs at least 4x coverage, while a team at 40% may be fine at 2.5x. Applying a blanket 3x ratio across all teams creates false confidence in some places and wasted effort in others.
Validate your target ratio against your team's actual historical win rate, not industry averages.
Low Coverage (Under 2x)
When pipeline falls below 2x quota, the ratio is telling you something specific. It typically signals:
- Insufficient pipeline generation
- Weak lead qualification
- Unrealistic quotas
To close the gap:
- Accelerate outbound and demand generation efforts
- Tighten qualification criteria to focus on higher-probability deals
- Identify which reps or territories are under-covered and investigate root causes
When High Coverage Becomes a Problem
A ratio of 8x–10x isn't automatically a win. Inflated pipelines often indicate:
- Stale deals that haven't progressed in months
- Unqualified opportunities logged to inflate numbers
- Reps padding the pipeline to avoid scrutiny
To clean it up:
- Run deal aging reports to flag opportunities stalled beyond 45–60 days
- Apply stage-by-stage conversion analysis to spot bottlenecks
- Remove or re-qualify deals that haven't advanced
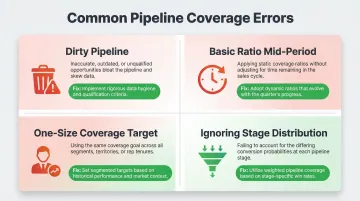
Common Errors That Undermine Your Pipeline Coverage Measurement
These four errors show up repeatedly across sales teams, and each one skews your coverage number in a different way.
Not Cleaning the Pipeline Before Measuring
Including stale, unqualified, or slipped deals from prior periods inflates the ratio and creates misleading numbers. This is a leading reason teams miss quota despite coverage that looks healthy on paper.
CRM data quality directly impacts accuracy. Research shows that 76% of CRM entries are less than half complete, missing critical fields required for accurate forecasting. Only 35% of sales professionals completely trust the accuracy of their organization's data.
Fix: Establish a regular pipeline hygiene cadence. Remove deals stalled beyond 60 days or move them to a separate "nurture" stage.
Using Only the Basic Ratio Mid-Period
The raw ratio is most meaningful at the start of a quarter. Partway through, recalculate against remaining quota (target minus already-won deals) and only the live, active pipeline. Otherwise, the ratio always looks artificially healthier than reality.
Applying a One-Size-Fits-All Coverage Target Across All Reps
A new rep with a 15% win rate needs a very different coverage ratio than a seasoned rep at 40%. Applying a single company-wide threshold ignores rep tenure, territory maturity, and how large their typical deals are, producing bad calls in both directions.
Fix: Set minimum pipeline thresholds per rep aligned to their individual win rate.
Ignoring Pipeline Stage Distribution
Two pipelines with identical 4x coverage ratios can have vastly different outcomes if one is concentrated in early-stage (low probability) deals versus late-stage deals.
Fix: Always review the stage breakdown when assessing coverage, not just the aggregate number. Calculate weighted coverage alongside the basic ratio.
Best Practices for Keeping Pipeline Coverage Healthy
Run Weekly Pipeline Reviews with Stage and Rep Segmentation
Staying on top of coverage means reviewing it frequently, not just at the start of each quarter. Teams that conduct structured weekly pipeline reviews achieve significantly higher forecast accuracy. Research shows teams reviewing pipeline weekly hit 87% forecast accuracy, whereas ad-hoc review teams hit only 52%.
Break coverage down by rep, territory, and product line to catch gaps early and redirect resources before it's too late. Set minimum pipeline thresholds per rep aligned to their individual win rate, not a company-wide average.
Combine Coverage with Complementary Metrics for a Complete Picture
Pipeline coverage alone doesn't tell you which deals will close or when. Pair it consistently with:
- Win rate trends: Validates whether coverage is truly sufficient
- Deal velocity: Assesses how fast deals are moving through stages
- Stage conversion rates: Spots bottlenecks where deals stall
- Forecast accuracy: Measures how reliably your team predicts outcomes
Together, these metrics give you a complete picture, not just how much pipeline exists, but how much of it is actually moving.
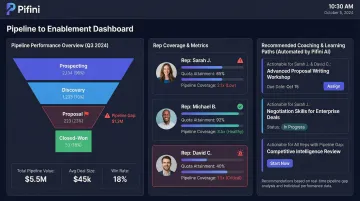
Link Pipeline Coverage Gaps to Enablement Action
When a rep's pipeline coverage falls short, the root cause is often a skills or knowledge gap, not just a prospecting problem. Organizations with mature enablement functions achieve 49.0% win rates on forecasted deals compared to 42.5% for those without.
Pifini connects pipeline performance data directly to rep enablement, automatically surfacing training gaps when coverage is low and routing reps into targeted coaching. When call scoring or pipeline progression metrics flag a struggling user, the platform auto-enrolls them in prescriptive learning paths with no manual admin work required. The result: leaders stop chasing symptoms and fix the actual gap driving coverage shortfalls.
Frequently Asked Questions
What is pipeline coverage analysis?
Pipeline coverage analysis examines whether your current pipeline holds enough qualified opportunity value to meet revenue targets. It combines a ratio of total pipeline value to quota with assessments of deal quality, stage distribution, and velocity.
What metrics do you consider essential for assessing pipeline coverage?
Four metrics matter most alongside the coverage ratio:
- Win rate, validates whether your ratio is actually sufficient
- Deal velocity, shows how fast opportunities are progressing
- Stage conversion rates, reveals bottlenecks slowing deals down
- Deal age, flags stale opportunities that inflate the number artificially
What is a good pipeline coverage ratio?
The typical benchmark is 3x–5x depending on sales segment, but the "right" ratio for any team is determined by its historical win rate. A team closing 25% of deals needs 4x or more, while a high-performing team at 40% may be fine at 2.5x.
What is the difference between weighted and unweighted pipeline coverage?
Unweighted coverage sums raw deal values across all open opportunities, ignoring close likelihood. Weighted coverage multiplies each deal's value by its stage probability, producing an Expected Revenue figure that more accurately reflects what will actually close.
How often should you review pipeline coverage?
Review pipeline coverage weekly at the rep and team level, with deeper analysis at the start of each quarter when targets reset. Mid-period reviews should always compare remaining quota against active pipeline, not total quota.
Can pipeline coverage be too high?
Yes. An unusually high ratio (above 7x–8x) can signal a bloated pipeline filled with unqualified or stalled deals, which gives sales leaders a false sense of security and makes accurate forecasting harder rather than easier.