Introduction
Average B2B win rates sit at just 20–21%, and enterprise deals are worse, dropping to 12–18%. Sales leaders now have more data at their disposal than any previous generation, yet most teams still default to gut instinct over systematic analytics. That disconnect costs millions in lost revenue every year.
Improving win rates with analytics isn't just about pulling more reports. Results depend on which metrics you track, how your data is structured, and whether insights actually change how reps sell.
That last part is where most efforts break down. 76% of CRM users report that less than half their organization's CRM data is accurate and complete, meaning the data powering those dashboards is unreliable from the start.
This guide walks through exactly how to apply data analytics to improve win rates, what must be in place before you start, the metrics that actually move the needle, and the mistakes that make the whole effort fail.
Key Takeaways
- Improving win rates requires clean CRM data, well-defined metrics, and repeatable deal-review workflows, not dashboards alone
- Win/loss analysis delivers measurable ROI: 63% of companies with formal programs saw increased win rates
- Track win rate by rep, stage conversion rates, sales cycle length, and lead source, not vanity activity metrics
- Predictive analytics surfaces which deals are most likely to close and flags at-risk opportunities early
- Linking training data to win rates shows exactly which skills move deals forward, making coaching decisions easier to prioritize
How to Increase Sales Win Rates Using Data Analytics
Step 1: Audit Your Existing Win Rate Data and CRM Health
Analytics efforts are only as strong as the underlying data. Before launching any win rate improvement initiative, assess whether your CRM can support meaningful analysis.
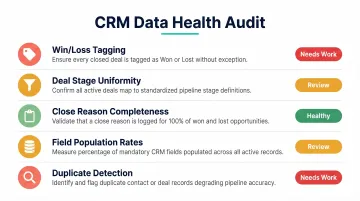
What a proper CRM data audit includes:
- Win/loss tagging, Confirm closed deals are consistently marked won or lost across all reps and deal stages
- Deal stage uniformity, Verify stages are defined and used consistently across the organization
- Close reason completeness, Review what percentage of closed opportunities have documented reasons (wins and losses)
- Field population rates, Measure how many critical fields (deal size, competitor, industry, lead source) are populated
- Duplicate detection, Identify duplicate opportunity records that distort pipeline and win rate calculations
These gaps directly distort win rate calculations. When only 30% of lost deals have documented close reasons, you're building strategy on a fraction of the data. When deal stages mean different things to different reps, conversion metrics become meaningless.
Poor data quality costs organizations an average of $12.9 million yearly. Fix the foundation first.
Step 2: Define What "Win Rate" Means for Your Organization
Teams often compare apples to oranges when they haven't aligned on a win rate definition. Win rate can be measured multiple ways, and each reveals different insights.
Common win rate definitions:
- Overall closed-won rate, Total deals won ÷ total deals closed (won + lost)
- Qualified opportunity win rate, Deals won ÷ qualified opportunities created (excludes unqualified leads)
- Revenue win rate, Total contract value won ÷ total contract value in closed deals
- Stage-specific win rate, Conversion rate from one stage to the next (demo-to-proposal, proposal-to-close)
- Segment win rate, Win rate broken down by deal size, industry, or customer segment
Standardize on at least two definitions:
- Overall closed-won rate, Provides the headline metric for organizational performance
- Stage-by-stage conversion rate, Reveals where deals are being lost in the pipeline
Together, these two measures give you both the headline number and the diagnostic detail to act on it.
Step 3: Conduct a Structured Win/Loss Analysis
Most organizations conduct win/loss analysis reactively on large deals only. A data-driven approach runs it continuously on all closed opportunities to surface trends earlier.
What proper win/loss analysis involves:
- Tag every closed deal with a primary win or loss reason
- Analyze patterns across deal size, industry, competitor involved, rep, and sales cycle length
- Look for statistically significant differences between won and lost deals
- Incorporate behavioral data from calls and emails, not just CRM outcome fields
Research from McKinsey analyzing 40,000 deals found that top sales reps spent 22% more time on external customer-facing interactions than low performers. This behavioral pattern only becomes useful when paired with outcome data showing which activities correlate with wins.
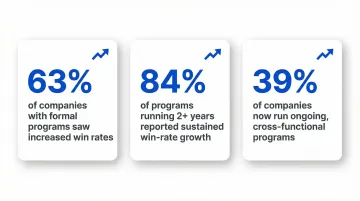
The ROI of consistent win/loss analysis:
- 63% of companies with formal win-loss programs saw increased win rates
- 84% of programs running for 2+ years reported sustained win-rate growth
- 39% of companies now run ongoing, cross-functional programs (up from reactive approaches)
Winning deals typically hinges on how sellers connect buyer needs to ROI, minimize perceived risk, and collaborate proactively, not on product features alone.
Step 4: Apply Predictive Analytics to Prioritize High-Win Opportunities
Predictive analytics helps teams focus time on deals with the highest win probability and identify at-risk opportunities before they're lost.
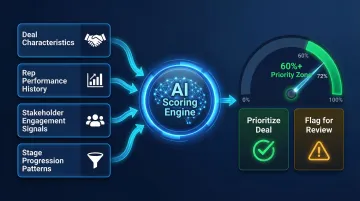
How predictive deal scoring works:
Historical win data trains models to score active opportunities by likelihood of closing. The algorithm analyzes:
- Deal characteristics (size, industry, lead source)
- Rep performance history and sales cycle velocity
- Stakeholder engagement signals
- Stage progression patterns
Reps and managers can then prioritize deals above 60% likelihood and investigate any deal that drops sharply mid-cycle.
Real-time risk detection:
Predictive analytics also flags deals at risk mid-cycle, identifying stalled opportunities, missing stakeholders, or competitive threats before they cause a loss. This differs from analyzing win rates only after deals close.
AI-powered predictive forecasting can detect deal stall and slip risk 2-3 weeks early compared to reactive review. Organizations using revenue orchestration and predictive analytics achieved a 6% increase in win rate, leading to $25M in new revenue over three years for the composite organization studied by Forrester.
Step 5: Close the Loop by Linking Training and Enablement Data to Win Rates
Knowing which deals are at risk is only half the equation. The next step is understanding whether your reps have the skills to win them. Most organizations treat sales training and sales analytics as separate systems, the most effective approach connects rep readiness scores, certification completion, and call performance data directly to win rate outcomes.
Why this matters:
When you link training data to deal outcomes, you can see which skills and knowledge gaps are costing wins, and which enablement investments are driving revenue.
What connected analytics reveal:
- Win rates by certification status (certified vs. uncertified reps)
- Deal outcomes by training score tier (top performers vs. bottom quartile)
- Pipeline growth by enablement cohort (trained on new product vs. not trained)
- Call performance scores correlated with close rates
Pifini is built specifically to bridge this gap. By linking training performance and AI-scored call data to actual deal outcomes, sales leaders can identify which capabilities drive wins and route reps into targeted training when performance patterns emerge.
When call scoring flags objection handling weaknesses in a rep's conversations, the system automatically triggers enrollment in the relevant training modules. The result is a continuous improvement loop where every lost deal becomes a data point for the next one.
Key Metrics That Directly Influence Win Rates
Not all metrics are equal. Diagnostic metrics reveal why win rates are what they are. Vanity metrics just count activity volume, they never connect to outcomes. The five metrics below are diagnostic.
Win Rate by Rep, Segment, and Deal Size
Disaggregating win rate is critical. A 25% overall win rate that hides a 55% win rate for enterprise deals and a 10% win rate for SMB deals requires a completely different intervention than a flat 25% across all segments.
Why segmentation matters:
- Rep-level variation reveals who to coach and who to replicate
- Segment differences show where your solution fits, and where it doesn't
- Deal size patterns surface whether your process is built for the wrong deal type
If enterprise reps average 18% win rates while mid-market reps hit 28%, the problem isn't talent, it's likely process, pricing, or product-market fit at that tier.
Stage-by-Stage Conversion Rates
Tracking conversion rates between each deal stage reveals where deals are being lost in the pipeline.
Common conversion breakdowns:
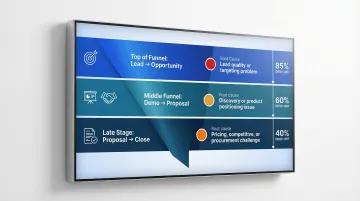
- Top of funnel (qualification): lead-to-opportunity conversion
- Middle funnel (demo-to-proposal): discovery effectiveness and solution fit
- Late stage (proposal-to-close): pricing, procurement, and competitive displacement
Each stage failure has a distinct cause:
- Low qualification conversion → lead quality or targeting problem
- Low demo-to-proposal conversion → discovery or product positioning issue
- Low proposal-to-close conversion → pricing, competitive, or procurement challenge
Focusing only on overall win rate masks these critical distinctions.
Sales Cycle Length vs. Win Rate Correlation
There is a stark inverse correlation between sales cycle length and win probability. Opportunities closed within 50 days carry a 47% win rate, but past that threshold, win rates plummet to 20% or lower.
Every week a deal drags is a week the buyer finds a reason to stall, competitors gain ground, or internal priorities shift. Longer cycles don't just delay revenue, they actively reduce the probability of winning.
Cycle length by deal size:
| Deal Size (ACV) | Typical Cycle Length | Average Win Rate |
|---|---|---|
| SMB (<$15K) | 14-30 days | 20-28% |
| Mid-market ($15K-$100K) | 30-90 days | 20-28% |
| Enterprise (>$100K) | 90-180+ days | 12-18% |
Enterprise deals face longer cycles due to larger buying committees (now averaging 6.8 to 10 stakeholders) and tighter budget scrutiny. Understanding your cycle-to-win-rate relationship by segment reveals whether compression efforts should focus on early qualification, mid-stage momentum, or late-stage acceleration.
Lead Source Win Rate
Win rate by lead source tells you which channels produce closeable deals, not just activity.
Common lead source categories:
- Inbound marketing (content, SEO, paid ads)
- Outbound prospecting (cold outreach, ABM)
- Partner/channel referrals
- Direct customer referrals
- Events and trade shows
If partner referrals close at 45% while cold outbound closes at 12%, doubling down on partner enablement delivers better ROI than hiring more SDRs. Let the data drive the resource decision.
Competitive Win/Loss Rate
Tracking win and loss rates against specific competitors enables data-driven competitive battlecards. It also tells sales leaders whether a win rate problem is internal (skills, process) or competitive (positioning, pricing, product gaps).
What competitive analysis surfaces:
- Competitors you consistently beat, and the patterns behind those wins
- Competitors who consistently beat you, and the deal scenarios where it happens
- Whether losses trace back to competitive displacement or internal execution gaps
- Which battlecard strategies and positioning moves actually correlate with closed deals
If you lose 70% of deals when Competitor X is involved but win 60% when they're not, the problem isn't your sales process, it's competitive positioning and differentiation.
What You Need Before You Start
Most win rate analytics initiatives fail for the same reason: the foundation wasn't ready. Rushing to dashboards before fixing data hygiene and team readiness produces misleading results, not insight.
CRM and Data Infrastructure Readiness
Minimum CRM requirements:
- Consistent deal stage definitions across the team, no rep-specific interpretations
- Mandatory close reason fields that can't be bypassed when marking deals closed-lost
- Standardized opportunity naming conventions that enable pattern detection
- At least 12–18 months of closed deals for reliable pattern detection
- Field validation rules that prevent incomplete records from being marked "closed"
Without these, you're analyzing noise, not signal.
Analytical Skill Readiness Across the Team
72% of sellers feel overwhelmed by the number of skills required for their job, and overwhelmed sellers are 45% less likely to attain quota. Investment in data literacy across sales managers and reps is a prerequisite, not an afterthought.
What readiness looks like:
- Managers can interpret conversion funnels and identify bottlenecks
- Reps understand how their activities connect to pipeline metrics
- Leadership can distinguish correlation from causation in performance data
- The team knows which metrics to ignore (vanity) vs. which to act on (diagnostic)
That gap shows up in the numbers: 84% of data and analytics leaders say their data strategies need a complete overhaul before their AI ambitions can succeed, pointing to a persistent gap between technological ambition and foundational readiness.
Tool Integration and Single Source of Truth
Win rate analytics requires data from multiple sources, CRM, call recordings, email engagement, and training systems, to be connected. Teams working from disconnected tools will always have an incomplete picture of what drives wins.
Integration requirements:
- CRM ↔ Training platform (to correlate certification with win rates)
- CRM ↔ Conversation intelligence (to connect call behaviors to outcomes)
- CRM ↔ Marketing automation (to track lead source performance)
- CRM ↔ Partner management systems (for channel visibility)
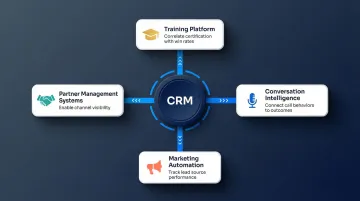
Platforms like Pifini connect these data streams into a single connected view, correlating training progress, call scoring, and deal outcomes so you can see exactly which capabilities drive revenue. Without that integration, you're manually stitching together reports, and they're already out of date before you share them.
Common Mistakes to Avoid When Using Data Analytics for Win Rates
Measuring Win Rate Only at the Overall Deal Level
An overall average is accurate and useless at the same time because it provides no actionable signal about where to intervene. Tracking only aggregate win rate obscures critical patterns by segment, rep, stage, and lead source.
Tracking Activity Metrics Without Connecting Them to Outcomes
Calls made, emails sent, and meetings held are effort metrics, not effectiveness metrics. Organizations that optimize for call volume may never notice that conversion rates are declining and pipeline quality is eroding.
The McKinsey finding about top reps spending 22% more time with customers only becomes useful when paired with outcome data. More customer time correlates with higher win rates, but the quality of that time matters. High-impact interactions focus on:
- Discovery questions that surface real buyer priorities
- Objection handling that addresses specific deal blockers
- Value articulation tied to the buyer's business case
Treating Win/Loss Analysis as a One-Time Exercise
Running post-mortems only after big losses means patterns only emerge after significant revenue has been lost. Patterns become statistically meaningful only when win/loss reasons are captured consistently across all closed deals over time.
Continuous analysis surfaces trends early enough to adjust mid-quarter, retrain teams, and refine messaging before losing an entire segment.
Collecting Data But Not Changing Rep Behavior
That analysis only matters if it drives action. The real gap isn't data availability, it's the lack of a clear process for turning analytics into coaching actions and training interventions at the rep level.
Dashboards surface the problem. What actually moves win rates:
- Coaching sessions triggered by deal-level performance data
- Training modules auto-assigned when skill gaps appear in call scores
- Process adjustments made at the stage where conversion consistently breaks down
When Data Analytics Has the Greatest Impact on Win Rates
Data analytics has the highest ROI for win rate improvement when specific conditions are present.
Ideal conditions for analytics-driven improvement:
- At least 50 closed deals per quarter to produce statistically meaningful patterns
- Measurable performance variation between reps, giving analytics something to identify and replicate
- Sales cycles longer than 30 days, leaving time for in-flight coaching to change outcomes before close
- Consistent CRM data entry across the team, field population discipline determines data quality
Scenarios where analytics has limited immediate impact:
- Fewer than 50 closed deals per quarter (insufficient sample size for reliable pattern detection)
- Teams with inconsistent CRM hygiene, incomplete or inconsistent records produce misleading patterns
- Win rate problems rooted in product gaps or pricing issues rather than sales execution (analytics will diagnose this, but cannot fix it)
Where analytics delivers unique value: Channel and partner sales
This is where the stakes get highest. Win rate visibility across distributed partner networks is nearly impossible without a connected platform. The top 30 partners generate the same revenue as the bottom 970 partners combined, yet most organizations have no visibility into what separates top partner performance from the rest.
Data analytics becomes the only scalable way to identify which partners are winning, what's driving their performance, and how to replicate that success across the network. Platforms built specifically for partner ecosystems, such as Pifini's Partner Enablement Hub, provide this cross-partner visibility by correlating training, enablement, and deal outcomes across hundreds of partner organizations.
Frequently Asked Questions
Frequently Asked Questions
How would you use data to improve sales performance?
Start with diagnostic metrics, win rate by stage, rep, and segment, rather than activity volume. Structured win/loss analysis surfaces the patterns that matter, letting you direct coaching, process fixes, and enablement investments at root causes rather than symptoms.
How can technology improve sales?
Sales technology removes manual CRM errors through automated data capture, surfaces predictive signals on which deals are likely to close, and delivers real-time coaching at the moment it's needed. The best platforms flag at-risk opportunities, suggest next-best actions, and route reps into targeted training when skill gaps appear.
What are the 5 C's of data analytics?
The 5 C's are Collection (gathering data from CRM, calls, and training systems), Cleaning (removing duplicates and validating completeness), Correlation (identifying patterns between activities and outcomes), Conclusion (determining what the data means), and Communication (translating insights into action).
What is a good sales win rate benchmark to aim for?
Win rate benchmarks vary significantly by industry, deal size, and sales model. Average B2B win rates are 20-21% overall, 29% for qualified opportunities, and 12-18% for enterprise deals over $100K ACV. The more important comparison is your own win rate trend over time and win rate by segment relative to internal targets, not industry averages.
Which metrics most directly predict whether a deal will be won or lost?
Stage conversion rates, time-in-stage, stakeholder count, and champion identification are among the strongest predictive signals. Multi-threading boosts win rates by 130% in deals over $50K, and communication red flags cut win probability by 33%. Analyze these signals together for the clearest picture.
How does sales training data connect to win rates?
Linking training completion, assessment scores, and call performance data to closed deal outcomes reveals which skills correlate with winning. That connection enables prescriptive coaching, routing struggling reps into specific modules that address their gaps, and makes it possible to measure training ROI by actual revenue impact.