
Introduction
Most sales managers obsessively track revenue numbers, yet they struggle to explain why some reps consistently underperform. The problem isn't a lack of data, CRMs overflow with pipeline stages, activity logs, and close rates. The real issue is the absence of a structured performance analysis framework that transforms raw data into actionable coaching.
When 69% of B2B sales reps fall short of quota and rep turnover climbs from 22% to 36%, waiting for a missed quarter to act is too late. Sales leaders need a system that spots skill gaps early, recognizes high performers before they leave, and corrects course while deals are still winnable.
This guide walks through exactly that: which KPIs to track by role, how to build a review cadence that goes beyond quarterly check-ins, and how to turn performance data into coaching that actually sticks.
What Is Sales Rep Performance Analysis, and Why It Matters
Sales rep performance analysis is a continuous system of measuring behaviors, outputs, and outcomes to identify skill gaps, reward high performance, and course-correct early. Unlike a quarterly review, it runs continuously, embedded into weekly management rhythms rather than bolted on at the end of each quarter.
The cost of getting this wrong is steep. Salesforce's State of Sales (2024) reported that 84% of sales reps missed quota last year, and sales teams experienced an 18% average staff turnover. Each SDR departure costs between $78,500 and $149,000 when you factor in replacement costs, lost pipeline during vacancy, and ramp productivity loss.
The Mindset Shift: From Event to System
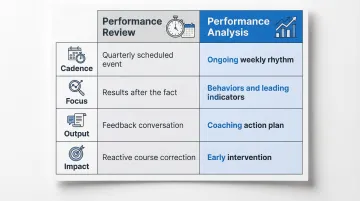
High-performing sales organizations draw a clear line between performance reviews and performance analysis. The distinction shapes everything about how managers operate week to week.
| Performance Review | Performance Analysis | |
|---|---|---|
| Cadence | Quarterly scheduled event | Ongoing, weekly rhythm |
| Focus | Results after the fact | Behaviors + leading indicators |
| Output | Feedback conversation | Coaching action plan |
| Impact | Reactive course correction | Early intervention |
Organizations that conduct formal, dynamic coaching achieve a 55.2% win rate, 13.4 percentage points higher than those using random approaches. They see 21.3% improvement in quota attainment and 32.1% improvement in win rates. Those gains don't come from better dashboards. They come from managers who act on patterns consistently, not just when a rep misses quota.
Key KPIs for Measuring Sales Rep Performance
The right KPIs fall into three categories: activity metrics, efficiency metrics, and outcome metrics. One category alone gives an incomplete picture, a rep with high activity but poor outcomes has a skill gap, not a work ethic problem. A rep with strong outcomes but declining activity is headed for a pipeline crisis next quarter.
Activity Metrics: What Reps Are Doing
Activity metrics measure effort and pipeline-generation behavior. They're most valuable for SDRs and early-stage prospecting roles.
Key activity metrics include:
- Call volume and email outreach
- Meetings booked and demos scheduled
- Lead response time
- Outbound connection rate
These metrics reveal whether reps are doing the work required to build pipeline. High activity with low conversion signals a skill gap, perhaps weak qualification, poor messaging, or ineffective discovery. Don't mistake low activity for laziness; it's often a symptom of burnout, unclear priorities, or territory quality issues.
Efficiency Metrics: How Well Efforts Convert
Once you know what reps are doing, the next question is how well it's working. Efficiency metrics reveal whether bottlenecks are rep-related or process-related.
Track these efficiency metrics:
- Win rate (opportunity-to-close ratio)
- Sales cycle length
- Deal slippage rate (opportunities pushed to future quarters)
- Stage-to-stage conversion rates
The median win rate across B2B sales is 19%, while HubSpot reports an average of 21%. If your reps consistently fall below that benchmark, the issue isn't volume, it's qualification, discovery, or deal management.
Mid-market sales cycles average 6.2 months, with enterprise cycles stretching 7–9 months. If your reps' cycles run significantly longer, pinpoint where deals stall. Whether it's technical evaluation, pricing negotiations, or legal review, the stall point tells you whether the problem is rep skill, internal process, or buyer-side friction.
Outcome Metrics: What Results Are Achieved
Outcome metrics are the bottom-line measures every rep should be evaluated against, but only in context with activity and efficiency data.
Key outcome metrics include:
- Quota attainment
- Average deal size
- Pipeline value and coverage ratio
- Customer retention rate (for account managers)
Average global quota attainment stood at 43% in Q4 2024. Before you label every rep below that mark as underperforming, consider territory design, lead quality, and market conditions. Forrester notes that average B2B quota attainment sits around 47%, a structural reality of how quotas are set, not pure underperformance.
Avoid KPI Overload
Don't track too many KPIs simultaneously. Recommend 4–6 KPIs per rep depending on their role and stage. Teams tracking five to seven KPIs hit 91% average quota attainment versus 73% for teams tracking fewer than three. But overloading reps with metrics leads to confusion and disengagement.
Each KPI should map to a specific behavior you can coach, not just a number to hit. Benchmark against the rep's own historical baseline and team averages, so you're measuring growth and context, not just distance from an arbitrary target.
How to Conduct a Sales Rep Performance Analysis: A Step-by-Step Process
Effective performance analysis follows a consistent process that transforms data into development. Here's the five-step framework:
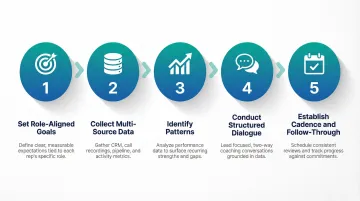
Step 1: Set Role-Aligned Goals Before the Analysis Period
Goals should be defined in advance with the rep's input, tied to both individual career objectives and team revenue targets. This makes the analysis feel collaborative rather than punitive.
If you're evaluating an AE, set goals around quota attainment, win rate, and sales cycle length. For an SDR, focus on meeting conversion rate, outreach volume, and lead quality scores. For an AM, emphasize renewal rate and upsell revenue.
Document these goals in writing. When the review period ends, you'll compare actual performance against agreed-upon targets, not subjective impressions.
Step 2: Collect Data from Multiple Sources
Pull quantitative data from your CRM: pipeline stages, close rates, activity logs, deal size, and velocity. Layer in qualitative inputs too, call recordings, peer observations, and customer feedback to build a full picture.
76% of CRM users report that less than half of their entries are complete and accurate, so verify data quality before making judgments. If a rep's activity count looks unusually low, listen to their calls and check whether they're logging interactions properly.
Platforms like Pifini automatically score sales calls using AI, flagging specific skill gaps such as weak objection handling or inconsistent discovery questioning. The result is objective, behavior-level insight that quantitative CRM data can't surface on its own.
Step 3: Identify Patterns, Not Just Snapshots
Compare current period performance against the rep's own historical data and team benchmarks. Look for consistent trends, deals always stalling post-demo, conversion rates declining month-over-month, or activity dropping in specific weeks, rather than reacting to one-off outcomes.
A single lost deal doesn't indicate a performance problem. Three consecutive quarters of declining win rates does.
Step 4: Conduct the Review as a Structured Dialogue
Structure each review conversation around four moves:
- Open with strengths, cite specific data ("Your average deal size increased 18% this quarter")
- Address gaps with evidence, name what shifted and where ("Your win rate dropped from 24% to 16%, let's look at your demos")
- Invite self-reflection, ask the rep to diagnose before you prescribe ("What do you think is causing deals to stall at pricing?")
- Close with commitments, document 2-3 specific development actions with timelines and owners
Reps often know exactly where they're struggling. The structured dialogue surfaces that knowledge and converts it into shared accountability.
Top-performing sales managers are 51% more likely to engage in regular coaching sessions that provide consistent direction, and 40% more likely to lead high-value coaching conversations that reinforce role clarity.
Step 5: Establish a Cadence and Follow-Through System
Quarterly reviews alone are insufficient. In teams where reps are coached weekly or more, 76% are hitting quota. When coaching drops to monthly, attainment falls to 56%, and at quarterly or less, it sinks to 47%.
Recommend a rhythm of:
- Weekly activity check-ins (15 minutes, focus on pipeline-building behaviors)
- Monthly pipeline reviews (30 minutes, focus on deal progression and stage conversion)
- Quarterly deep-dive evaluations (60 minutes, focus on skill development and career trajectory)
Document action items from every session and track completion between meetings. Without that follow-through loop, even well-run reviews produce no lasting behavior change.
Role-Specific Performance Analysis: One Size Doesn't Fit All
An SDR, an Account Executive, and an Account Manager have fundamentally different responsibilities. Using identical KPIs across all roles produces inaccurate and misleading evaluations.
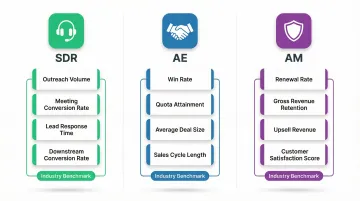
SDR-Specific Analysis
Success for an SDR is about pipeline generation, not deal closure. Evaluate on:
- Outreach volume (calls, emails sent per day)
- Meeting conversion rate and lead quality scores
- Lead response time on inbound inquiries
- Downstream conversion rate of booked meetings
SDR benchmarks show 104 total activities per day (40 phone calls, 40 emails) and 3.6 quality conversations per day. Average ramp time is 3 months.
Don't measure SDRs on closed revenue, they don't control what happens after handoff.
AE-Specific Analysis
Success for an AE is about closing efficiently and managing a pipeline that converts. Evaluate on:
- Win rate and quota attainment
- Average deal size and sales cycle length
- Stage-by-stage pipeline progression
Evaluate AEs on their ability to handle objections, negotiate pricing, and close within the expected timeframe.
If an AE consistently takes 8 months to close in a 5-month cycle environment, investigate their qualification process and stakeholder engagement, not just their activity volume.
AM-Specific Analysis
Success for an AM is about retaining and growing existing relationships. Evaluate on:
- Renewal rate and gross revenue retention (GRR)
- Upsell and expansion revenue
- Customer satisfaction scores (NPS, CSAT)
Median Net Revenue Retention (NRR) is 102% and median Gross Revenue Retention (GRR) is 91%.
Evaluate AMs on their ability to prevent churn, identify expansion opportunities, and maintain high customer satisfaction. Don't measure AMs on new logo acquisition, that's not their role.
Turning Performance Gaps Into Coaching and Improvement
Performance analysis is only valuable if it triggers specific, tailored action. The output of every analysis session should be a personalized development plan tied directly to identified gaps. If a rep struggles with objection handling, assign targeted role-play exercises, not a generic training course on "sales fundamentals."
How AI Closes the Gap Between Review Cycles
Waiting for a quarterly review to surface performance gaps is too slow. Platforms like Pifini evaluate every sales call in real time, flag specific skill deficiencies, and automatically enroll reps into targeted learning modules. Common gaps the system detects include:
- Inconsistent discovery questions (skipping budget or decision-process conversations)
- Weak pricing conversations that stall deals at negotiation
- Missing follow-up commitments at the close of calls
- Low talk-to-listen ratios indicating reps dominating rather than qualifying
83% of sales teams with AI saw revenue growth this year versus 66% without AI. Sellers who use AI to optimize their activities increase win rates by 50%.
When Pifini's call scoring detects a gap, it automatically routes the rep into training that addresses that exact deficiency. Performance improvement becomes continuous rather than something that happens four times a year.
Close the Loop Between Training and Results
Track whether reps who completed specific training modules show improvement in corresponding KPIs in the next cycle. If you assigned objection handling training in January, did win rates improve in February and March? If not, the training wasn't effective, or the performance issue wasn't actually related to objection handling.
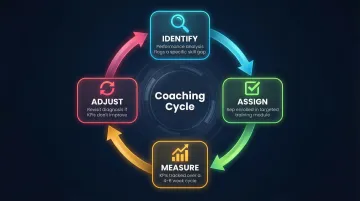
Organizations utilizing dynamic, personalized sales coaching achieve 21.3% improvement in quota attainment and 19.0% improvement in win rates. A practical closed-loop review looks like this:
- Identify: Performance analysis flags a specific gap (e.g., low discovery question frequency)
- Assign: Rep is enrolled in targeted training for that skill
- Measure: KPIs are tracked in the following 4–6 week cycle
- Adjust: If KPIs don't improve, revisit whether the gap diagnosis was accurate
If the numbers don't move after training, the root cause may be motivational or structural, not a skill issue. That distinction shapes your next intervention.
Common Mistakes That Undermine Sales Performance Analysis
Even well-intentioned performance analysis can fail when managers make these critical mistakes:
Mistake 1: Evaluating All Performance Dips as Rep Failures
Some performance issues are systemic, bad territory design, poor lead quality, outdated messaging, misaligned pricing, or broken internal processes. Good performance analysis distinguishes between rep-specific gaps and structural problems.
Organizations ineffective in territory design underperform by a 15% negative variance in sales objective achievement. Before concluding a rep is underperforming, verify:
- Their territory has adequate market potential
- Leads meet quality standards
- Internal resources (marketing support, sales engineering) are available when needed
Managers make the same attribution error in reverse, blaming individual reps when the root cause is territory imbalance or poor lead routing.
Mistake 2: Relying Only on Lagging Indicators
Lagging indicators like closed revenue and quota attainment tell you what already happened. They provide no coaching value because you can't change the past.
Build a balanced scorecard that includes leading indicators: activity levels, pipeline health, early-stage conversion rates, and meeting-to-opportunity conversion. If an AE's pipeline coverage drops from 4x to 2x, that signals a likely quota miss next quarter. Catching it early gives you 90 days to intervene, waiting until the revenue gap appears leaves no room to recover.
Mistake 3: Skipping Documentation and Follow-Through
Analysis without documented action steps and accountability is just conversation. End every performance analysis session with a written summary covering commitments, timelines, and a scheduled follow-up date.
Teams with a strong coaching culture and accountability framework see a 28% higher win rate than those without. Document what the rep will do, what the manager will provide (training resources, shadowing opportunities), and when you'll review progress. A scheduled follow-up transforms a one-time review into an ongoing accountability loop, which is where performance actually improves.
Frequently Asked Questions
What are the 5 key performance indicators in sales?
The five most widely used sales KPIs are quota attainment, win rate, sales cycle length, average deal size, and customer retention rate. However, the "right" five depend on the rep's role, SDRs should emphasize pipeline generation metrics, while AEs focus on conversion and AMs prioritize retention and expansion.
What is the 2-2-2 rule in sales?
The 2-2-2 rule is a follow-up cadence framework popularized by Mark Hunter: follow up 2 days after a meeting, 2 weeks later, and 2 months after that. In performance analysis, tracking this behavior reveals whether reps maintain deal momentum or let opportunities stall.
What is the difference between sales metrics and sales KPIs?
All KPIs are metrics, but not all metrics are KPIs. KPIs are specific metrics tied to strategic goals, while general metrics are broader data points that may not connect directly to business objectives. For example, "emails sent" is a metric; "meeting conversion rate" is a KPI because it directly impacts pipeline generation.
How often should you conduct a sales rep performance review?
Use a layered cadence: weekly activity check-ins (15 minutes), monthly pipeline reviews (30 minutes), and quarterly deep-dive evaluations (60 minutes). Teams that coach weekly see 76% quota attainment; monthly coaching drops that to 56%, and quarterly or less falls to 47%.
How do you measure sales rep performance fairly across different roles?
Fairness comes from role-aligned KPIs. SDRs should be measured on pipeline generation and meeting conversion, AEs on win rates and quota attainment, and AMs on retention and expansion, not universal metrics applied across all functions.
What tools are best for sales rep performance analysis?
The most effective setups combine three categories: a CRM for pipeline tracking (Salesforce, HubSpot), conversation intelligence software for call scoring, and an enablement platform that connects performance data to learning. Pifini unifies all three, automatically identifying skill gaps from call data and routing reps into targeted training without manual admin work.