Introduction
Every year, trillions of dollars change hands through formal RFP processes, yet most sales and proposal teams operate in the dark, unsure whether their 40% win rate is competitive, whether their 30-hour response time is dragging them down, or whether the investment they're making in content libraries and AI tools is paying off. Without reliable benchmarks, RFP performance becomes a guessing game, and that's a costly way to compete.
This article delivers the 2026 benchmarks you need to compare performance, compete smarter, and improve. Inside, you'll find:
- Win rate averages by company size, industry, and region
- Response time benchmarks that separate fast movers from the pack
- Revenue impact data that quantifies what's at stake
- Team and process stats from top-performing organizations
- AI adoption trends reshaping the competitive landscape
- Actionable strategies to close the gap between where you are and where you need to be
TLDR: Key RFP Statistics at a Glance
- Average win rate is 45% (up from 43% in 2024), with top performers hitting 60%+
- Response time averages 25 hours, down 17% year-over-year; AI automation cuts this to under 5 hours
- RFPs drive 39% of total revenue, $256M average annually, which puts win rate squarely at the center of revenue planning
- **68% of teams now use generative AI** (doubled from 34% in 2023); 65% use dedicated RFP software
- Relationship-based pursuits yield 60–90% win rates vs. 15% for cold bids, the single biggest lever teams can control
RFP Win Rate Benchmarks 2026
The overall average RFP win rate is 45% as of the most recent full-year data (2025 reporting period). That's a two-point gain from 43% the prior year and reflects both increased AI adoption and more disciplined go/no-go qualification across industries.
Win Rates by Company Size
Enterprise advantage stems from dedicated proposal teams and larger content libraries, not just brand recognition:
- Enterprise (5,000+ employees): 47%
- Mid-Market (500–4,999 employees): 45%
- SMBs (under 500 employees): 42%
Win Rates by Industry
Industry variance reflects differences in procurement complexity, competition density, and relationship-based selection:
| Industry | Win Rate |
|---|---|
| Insurance | 52% |
| Technology | 46% |
| Healthcare | 44% |
| Financial Services | 43% |
| Government/Public Sector | 40% |
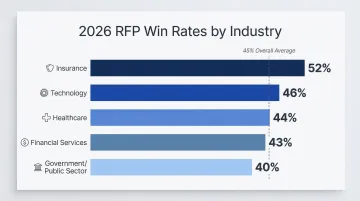
Insurance's high rate reflects fewer, more relationship-driven procurements. Government's lower rate stems from high competition and stricter compliance requirements that widen the competitive field.
Win Rates by Region
Where you operate matters less than it used to, RFP software adoption is standardizing response quality across markets:
- United Kingdom: 46%
- United States: 45%
- Global Average: 45%
The Top-Performer Gap
Teams ranked in the top quartile report win rates of 60% or higher. Key differentiators separating top performers from the average:
- Dedicated proposal ownership and accountability
- Active, continuously updated content libraries
- Formal go/no-go qualification processes
- AI-assisted drafting and content reuse
The go/no-go advantage: 81% of top performers use strict go/no-go decision processes to focus resources on high-probability deals. Selective pursuit, not volume, is what separates a 60% win rate from the average.
RFP Response Time & Efficiency Statistics
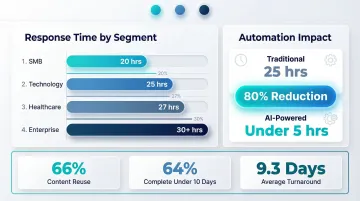
The headline benchmark: average response time is 25 hours per proposal, a 17% improvement from 30 hours the prior year. This reflects widespread adoption of content libraries and AI drafting tools.
Response Time by Company Size and Industry
| Category | Segment | Average Time |
|---|---|---|
| Company Size | SMB | 20 hours |
| Company Size | Enterprise | 30+ hours |
| Industry | Insurance | 20 hours |
| Industry | Technology | 25 hours |
| Industry | Healthcare | 27 hours |
| Industry | Advertising | 28 hours |
SMBs and Insurance move fastest. Enterprise teams average 30+ hours due to multi-stakeholder review cycles and compliance requirements.
The Automation Impact
Teams using AI-powered proposal software report reducing 25-hour average responses to under 5 hours, roughly 80% reduction. Content reuse is the single biggest driver.
Organizations with active content libraries consistently outperform those without. Key efficiency benchmarks:
- Reuse 66% of content across proposals on average
- 64% of teams complete responses in under 10 calendar days
- Average end-to-end turnaround lands at 9.3 days
Teams that respond faster win more, buyers read speed as a signal of operational maturity and solution confidence.
Revenue Impact: What RFPs Are Actually Worth
RFPs generate an average of $256 million in annual revenue per organization and account for approximately 39% of total company revenue. That makes proposal management one of the most direct levers on revenue in any B2B organization.
Revenue by Industry
Those averages shift dramatically by sector. Healthcare and media organizations see RFP revenue an order of magnitude above the technology baseline:
| Industry | Annual RFP Revenue |
|---|---|
| Healthcare | ~$1.05 billion |
| Advertising & Publishing | ~$499 million |
| Technology | ~$256 million |
The Cost of Abandonment
Approximately 20% of RFPs go unfinished each year, representing an estimated $725,000 in lost revenue per organization annually. Understaffed teams and the absence of a repeatable process are the primary culprits, both fixable with the right systems in place.
Federal Procurement Context
For teams pursuing government contracts, the numbers are even larger. The U.S. federal government awarded $755 billion in contracts in FY2024, with small businesses securing $183 billion (28.78% of total).
The competitive award rate was 68% in FY2024, meaning competition intensified slightly from prior years. State and local procurement adds hundreds of billions more, meaning the total addressable market for teams with a disciplined proposal process is far larger than federal figures alone suggest.
RFP Team & Process Benchmarks
Team Size by Company Size
The overall average is 8 people per RFP team:
- Enterprise: 14 people
- Mid-Market: 9 people
- SMB: 4 people
Each RFP involves an average of 9 contributors across departments. That cross-functional reach is the norm, not the exception.
The Team Ownership Trend
Dedicated proposal teams declined from 56% in 2023 to 43% in 2024, while sales-led RFP processes now account for 51% of organizations.
What this means for quality: Sales-led teams without a content library or defined process tend to produce less consistent proposals. Top performers maintain dedicated ownership even when sales drives the relationship.
The Collaboration Challenge
Research identifies SME collaboration, getting subject matter experts to review and contribute content on deadline, as the single biggest process headache for proposal teams. That friction compounds in sales-led models, where there's no dedicated owner to enforce timelines or maintain a shared content library. Organizations that standardize both tend to show faster turnaround and fewer last-minute rewrites.
AI & Technology Adoption in Proposal Management
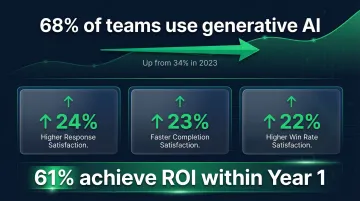
The AI Adoption Headline
68% of proposal teams now use generative AI in their RFP process, doubled from 34% in 2023. Among AI adopters, 32% use it daily. This is the fastest-shifting variable in RFP performance, and non-adopters are competing at a structural disadvantage on speed.
RFP Software Penetration
65% of teams now use dedicated RFP/proposal software, up from 48% in 2024.
Teams using RFP software report:
- 24% higher satisfaction with their ability to respond
- 23% higher satisfaction with completion time
- 22% higher satisfaction with proposal win rates
61% achieve measurable ROI within the first year of implementation.
Proposal Management Software Market Size
The global market is valued at approximately $3.26 billion in 2025, projected to reach $3.66 billion in 2026, with analysts forecasting 11–18% CAGR through 2034 driven by AI integration and cloud adoption. AI-powered proposal tools are now a mature, mainstream category, not an early-adopter bet.
The Performance Analytics Gap
Most teams track whether they won or lost an RFP, few connect outcome data back to root causes. The gaps that actually explain win rates include:
- Which reps or partners drove the win (or the loss)
- Which training or content deficiencies hurt proposal quality
- What patterns emerge by deal size, vertical, or partner tier
Platforms that link sales readiness analytics to actual deal outcomes, like Pifini's revenue enablement platform, give revenue leaders the visibility to understand why their win rate looks the way it does. For organizations selling through channel partners, this matters most: uneven training and inconsistent messaging directly erode proposal quality at the source.
How to Improve Your RFP Win Rate in 2026
Qualify More Aggressively with Data
Research consistently shows that the biggest predictor of win rate improvement is not writing better proposals, it is submitting fewer, better-chosen proposals.
Implement a formal go/no-bid scorecard that assesses:
- Relationship strength
- Solution fit
- Competitive position
- Resource availability
Teams that follow disciplined qualification frameworks concentrate effort on winnable opportunities and reduce their loss rate without reducing revenue. Relationship-based pursuits yield 60–90% win rates vs. just 15% for cold pursuits, the single largest controllable variable in RFP performance.
Invest in Content Infrastructure and AI Tooling
Teams with an active content library respond faster, reuse more content, and win more often. Building a centralized, continuously updated library of approved responses is the highest-ROI process investment available to most proposal teams.
Layering in AI-assisted drafting reduces per-proposal effort by 40–60% and frees proposal teams to spend time on customization and competitive positioning instead of rebuilding boilerplate. A well-maintained content infrastructure pays dividends on every submission:
- Cuts response time by reusing pre-approved, version-controlled answers
- Ensures consistent messaging across team members and regions
- Frees senior writers to focus on win themes rather than boilerplate
- Scales output without proportional headcount increases
Connect Training and Readiness to Win Rate Outcomes
Most organizations track win rates at the aggregate level but don't diagnose why rates vary across team members, regions, or partner channels.
Platforms like Pifini link seller training scores, certifications, and coaching data directly to deal outcomes, giving sales leaders a clear line of sight from enablement investment to win rate performance. This is particularly valuable for organizations selling through channel partners, where uneven training and inconsistent messaging translate directly into weaker proposals and lost deals.
Frequently Asked Questions
What is the average RFP win rate in 2026?
The overall average is 45% (from 2025 data), ranging from 42% for SMBs to 47% for Enterprise organizations. Top-performing teams consistently achieve 60%+ through disciplined qualification and AI-assisted processes.
What is considered a good RFP win rate?
"Good" is context-dependent based on industry, deal size, and competition level. However, 30–50% is widely considered a strong range, and any team above 50% is outperforming the majority of the market.
How do RFP win rates vary by industry?
Insurance leads at 52%, Technology at 46%, Healthcare at 44%, Financial Services at 43%, and Government/Public Sector at 40%. Differences stem from procurement complexity, competition density, and how heavily each sector weighs existing relationships over price.
How does company size affect RFP win rates?
Enterprise teams (47%) outperform SMBs (42%) primarily because of larger dedicated proposal teams, more mature content libraries, and more structured qualification processes, not inherently better solutions.
How much does AI improve RFP win rates?
Teams using RFP software report 22% higher satisfaction with win rates. AI-powered tools cut response time from 25 hours to under 5 hours. 68% of teams now use generative AI, and teams with mature AI-assisted content libraries report win rate gains that widen over time as response quality improves.
What percentage of company revenue comes from RFPs?
RFPs account for an average of 39% of total company revenue, generating $256M annually. The 20% of RFPs that go unfinished represent $725K in lost revenue per organization each year, a figure that makes RFP process improvement a direct revenue recovery opportunity.