Introduction
Companies worldwide are pouring billions into sales training, yet most of that investment remains unmeasured. The global sales training market is projected to reach $9.36 billion in 2026, with the median organization spending between $1,000 and $1,499 per salesperson annually on formal training. Despite this expenditure, a 2024 Brandon Hall Group study found that 65% of organizations struggle to quantify training ROI, risking misaligned budgets and continued underperformance.
Traditional ROI measurement frames training as a cost center rather than a growth driver. Most sales leaders track only revenue outcomes, quota attainment, win rates, pipeline growth, while the largest returns hide elsewhere: reduced turnover, faster onboarding, compliance risk prevention, and partner performance gains that never show up in standard reports.
Understanding hidden ROI means looking beyond revenue metrics to the avoided costs and compounding gains that training actually produces.
This analysis breaks down which ROI dimensions are most commonly missed, how to measure them, and how to build a framework that makes the full value of training visible to leadership.
Key Takeaways
- Sales training ROI extends far beyond revenue: the real returns come from retention, faster ramp time, compliance risk, and partner performance
- Traditional ROI formulas (revenue increase ÷ training cost) capture only a fraction of true business impact
- Hidden ROI spans rep retention, onboarding speed, compliance risk reduction, and channel ecosystem performance
- Measuring hidden ROI means connecting training activity directly to win rates, deal velocity, and partner revenue
- AI-powered enablement platforms like Pifini automate the connection between training inputs and revenue outputs, making hidden ROI visible and reportable
What Is Sales Training ROI, And Why the Standard Definition Falls Short
Sales training ROI is the measurable business value generated by investing in seller skill development, expressed relative to the cost of that investment. The standard formula, revenue increase divided by training cost, is deliberately narrow and favors short-term, easily attributable outcomes.
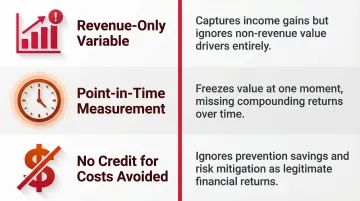
This traditional approach has three core limitations:
- Revenue as the only variable: The formula ignores non-revenue outcomes, retention improvements, onboarding efficiency, compliance protection, and partner ecosystem health, all of which generate real financial returns that never appear in a quota attainment report.
- Point-in-time measurement only: A trained rep who stays three years instead of one eliminates replacement costs, retains customer relationships, and builds institutional knowledge. That compounding value is invisible in standard calculations.
- No credit for costs avoided: Training prevents turnover, compliance failures, and slow ramp times. These avoided costs often exceed direct performance gains but never make it into a revenue-only ROI model.
Research confirms this measurement gap: only 27% of companies say their learning strategy includes a framework to measure success, and only 30% of organizations are good at using learning program data to make business decisions.
That gap points to a more complete framework. A "full-stack ROI" view accounts for both realized gains, performance improvement, quota attainment, win rates, and avoided costs: retention savings, compliance protection, and faster onboarding. When organizations measure both sides, training stops looking like an expense and starts looking like a compounding asset.
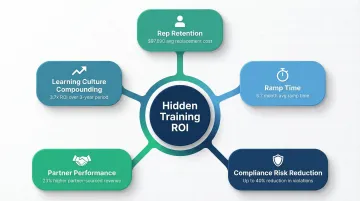
The Hidden ROI of Sales Training: 5 Dimensions Most Leaders Never Measure
These five dimensions are consistently undervalued because they're harder to observe in a quarterly revenue report, yet collectively they often outweigh direct performance gains. Each represents a distinct ROI driver with its own measurement logic.
Rep Retention and Turnover Cost Avoidance
Turnover is the single largest hidden ROI driver for most organizations. Losing a sales rep costs far more than their salary, recruitment, onboarding, lost pipeline, and eroded institutional knowledge all add up fast. A DePaul University study found that the average cost to replace a salesperson is $97,690, factoring in acquisition, training, and lost opportunity costs while you fill the vacant territory.
The direct link between training investment and retention is well-documented: reps who receive consistent development feel more competent and more valued, which reduces voluntary attrition. LinkedIn's Workplace Learning Report found that 94% of employees say they would stay at a company longer if it invested in their learning and development.
The compounding effect matters here: every additional year a trained rep stays increases their revenue contribution while reducing replacement risk. A rep who stays three years instead of eighteen months saves the organization nearly $100,000 in direct costs and preserves customer relationships worth far more.
Faster Rep Ramp Time and Time-to-Productivity
Ramp time is a silent revenue drain. A new hire who takes 9 months to reach quota versus 5 months costs the organization 4 months of revenue-generating output per hire. The Bridge Group's 2024 research shows the average ramp time for an Account Executive is now 5.7 months, up from 4.3 months in 2020.
Structured, well-sequenced training shortens ramp time by ensuring new hires develop the right skills in the right order, rather than learning reactively from deal losses. The Sales Management Association found that programs highly rated for structure and consistent application outperform low-rated programs by 37%, cutting average time-to-productivity from 9.1 months to 5.7 months.
For a 50-person sales team with an average quota of $1 million annually, reducing ramp time by three months recovers $3.75 million in annualized productivity per cohort.
Compliance Risk Reduction
In regulated industries, financial services, life sciences, healthcare technology, a single compliance violation can cost exponentially more than an entire year's training budget. Training ROI here is measured in risk-adjusted cost avoidance: the expected value of violations prevented.
Recent enforcement actions illustrate the stakes:
- FINRA ordered Securities America to pay $3 million in total penalties for failing to reasonably supervise mutual fund recommendations
- The FDA issued 30 warning letters to telehealth companies for false or misleading claims on compounded GLP-1 products
Compliance ROI is most defensible when organizations can demonstrate certification completion rates and link training records to auditable performance standards. For regulated industries, the cost of one prevented violation justifies years of training investment.
Channel and Partner Sales Performance
Most organizations measure direct rep training ROI more rigorously than partner training ROI, despite the fact that untrained partners make fewer sales, escalate more support issues, and misrepresent products, all of which cost the vendor directly.
The revenue impact is substantial: partners who complete certification programs earn 6x more revenue than untrained counterparts. Mature partner programs drive 2x revenue growth and contribute up to 28% of total company revenue on average. Given that CompTIA's State of the Channel 2024 found that 57% of technology vendor revenue flows through indirect channel partners, partner training ROI directly impacts more than half of total revenue.
When partners are properly enabled, they close more deals, require less hand-holding, and generate higher-margin revenue. For most organizations, this is the fastest path to incremental revenue that doesn't require a single additional hire.
Continuous Learning Culture and Long-Term Performance Compounding
Organizations with embedded continuous learning cultures see sustained performance improvement over time, not just a post-training bump. The ROI compounds: reps who receive regular reinforcement retain skills longer, adapt faster to market changes, and perform more consistently at quota.
CSO Insights research found that dynamic coaching processes improved win rates by 27.9% compared to informal approaches and improved quota attainment from 51.3% to 61.5%. The Sales Management Association found that firms providing optimal coaching realize annual revenue growth 16.7% greater than firms providing no coaching.
Peer-to-peer learning amplifies these gains further. Organizations that systematically capture and share top-performer knowledge, through structured coaching, call libraries, or AI-scored roleplay, scale the impact of every training dollar without increasing headcount or budget.
How to Measure the Full ROI of Sales Training: A Step-by-Step Framework
This framework moves beyond the traditional revenue-only formula and is structured to capture both direct performance gains and hidden cost avoidance. The goal is a defensible, data-backed narrative leadership can act on, not a perfect equation.
Step 1, Define the ROI Baseline
Identify the specific metrics that will serve as your before/after comparison points. This should include:
Traditional KPIs:
- Quota attainment percentage
- Win rate
- Average deal size
- Sales cycle length
Hidden ROI Metrics:
- Average ramp time (months to quota)
- Voluntary attrition rate
- Compliance incident count
- Partner revenue per enabled rep
Without a baseline, no post-training comparison is meaningful. Establish these metrics before launching any new training program.
Step 2, Segment Your Measurement by Audience
Direct reps, sales managers, and channel partners each carry different ROI profiles, which means measurement must be segmented accordingly.
A manager who receives coaching training generates ROI through their team's performance, not directly through their own deals. Failing to account for this multiplier significantly understates the return. If a manager coaches a team of 8 reps and improves each rep's win rate by 5%, the ROI should reflect 8x the individual impact.
Partner training ROI should be tracked separately with partner-specific pipeline and revenue attribution, measuring deals closed, pipeline generated, and support escalations avoided.
Step 3, Link Training Activity to Downstream Outcomes
The core measurement mechanism is connecting training completion data, certification scores, and skill assessments to CRM-level outcomes: win rates, average deal size, and cycle length. Compare trained versus untrained reps, or high-scoring versus low-scoring cohorts.
When you can show that reps who scored above 85% on certifications closed deals 12% faster or won 8% more often, hidden ROI becomes visible and attributable. Pifini does exactly this, its platform links training scores and certifications directly to deals closed and pipeline growth, integrating learning data with CRM outcomes so training's contribution is measurable and reportable.
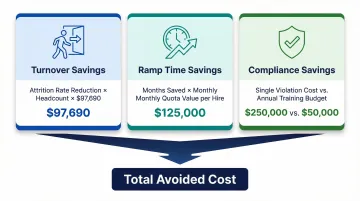
Step 4, Quantify Avoided Costs
Walk through the calculation logic for the three main cost-avoidance ROI categories:
- Turnover savings, If training reduces annual attrition from 30% to 22% for a 50-person team, you've avoided losing 4 reps. At $97,690 per replacement, that's $390,760 in annual avoided cost.
- Ramp time savings, If training cuts ramp time from 8 months to 5.5 months, each new hire recovers 2.5 months of productivity. For a rep with a $1M annual quota, that's $208,333 per hire recovered.
- Compliance savings, Preventing even one regulatory violation can return more than the entire annual training budget.
Use conservative, defensible estimates rather than inflated projections. It's better to understate and overdeliver than to lose credibility with optimistic numbers.
Step 5, Report ROI as a Range, Not a Single Number
The "contributed to" framing is the most credible approach with executives. Rather than claiming full ownership of a revenue increase, show the range of outcomes training contributed to alongside other business changes.
For example: "Training contributed to a 15-20% improvement in ramp time, correlated with a 6-8% increase in win rates among certified reps, and avoided an estimated $300,000-$400,000 in turnover costs."
Also track leading indicators, knowledge retention scores, coaching call quality, certification pass rates, as early signals before lagging revenue metrics move. Leading indicators appear within 30-60 days; revenue outcomes typically take 3-6 months to measure meaningfully.
Sales Training ROI in Practice: A Simplified Walkthrough
Consider a mid-market SaaS company with a 50-person direct sales team and a 30-partner channel network investing in structured onboarding and ongoing enablement training.
Baseline Metrics:
- Average ramp time: 8 months
- Win rate: 22%
- Voluntary attrition: 28% annually
- Partner revenue per enabled partner: $180,000
After running the program for two quarters, they measure outcomes:
Ramp Time Improvement:
- New reps now reach quota in 5.5 months (6-week reduction)
- For 12 new hires per year, that recovers 18 months of productivity
- At $83,333 per month in quota ($1M annual / 12 months), that's $1.5 million in recovered annual revenue
Retention Improvement:
- Voluntary attrition drops from 28% to 20% (8 percentage points)
- For a 50-person team, that prevents 4 departures annually
- At $97,690 per replacement, that's $390,760 in avoided annual cost
Partner Performance Improvement:
- Certified partners increase average annual revenue from $180,000 to $245,000 (36% improvement)
- With 20 active partners, that's $1.3 million in incremental partner-sourced revenue
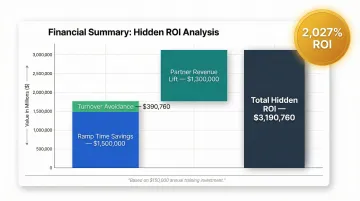
Total Hidden ROI:
- Ramp time savings: $1,500,000
- Turnover avoidance: $390,760
- Partner revenue lift: $1,300,000
- Total: $3,190,760 in annual impact
If the training investment was $150,000 annually ($50 per user for 100 direct reps + 2,000 partners), the ROI is 2,027%, and that's before counting direct rep performance improvements.
Those numbers only hold up if measurement is done right. Two mistakes consistently undermine otherwise solid ROI analyses:
Measuring too early: Teams expect revenue impact within 30 days, before behavioral change has had time to compound. Leading indicators (knowledge scores, certification rates) appear first; lagging indicators like win rates and retention take 3-6 months to move.
Measuring too broadly: Attributing all performance changes to training without isolating the variable. Always compare trained versus untrained cohorts, or pre/post periods, to separate training impact from other factors.
Frame the final ROI narrative as a range, not a precision figure: "Training contributed to a 31% improvement in ramp time, avoided an estimated $390,000 in turnover costs, and correlated with a 36% increase in partner-sourced revenue." That honesty makes the number more defensible, not less persuasive.
How Pifini Turns Sales Training Activity Into Measurable Revenue Impact
Most organizations face a fundamental infrastructure problem: training lives in one system, deal outcomes live in another, and nobody ever joins them. Pifini's unified platform closes that gap by linking certifications, training scores, and learning completion directly to CRM outcomes like win rates, pipeline growth, and deals closed.
The platform's core advantage is integration, not content. It automatically connects:
- Training completion data and certification scores
- AI-powered call scoring evaluating live customer conversations
- CRM deal outcomes (win/loss, deal size, cycle length)
- Partner performance metrics (revenue per partner, support escalations, deal registrations)
This unified intelligence layer shows exactly how training drives revenue. Instead of asking how many people completed a course, leaders can ask what changed because they did. Three capability areas drive that shift.
Rep Retention & Ramp Time
The AI-powered LMS auto-enrolls underperforming reps into targeted remediation. When sales call scoring flags gaps in discovery skills or objection handling, the system immediately assigns focused training modules, shortening skill gaps and ramp time without manual intervention.
Application Measurement
Real-time AI call scoring identifies where trained skills are or aren't being applied in live conversations, making "application" measurable rather than just "completion." When performance gaps appear, feedback loops route users directly into the LMS for prescriptive training.
Partner Training ROI
Partner-specific training tracks enable channel ROI measurement absent from legacy platforms like Seismic or Mindtickle. The Partner Enablement Hub tracks certifications, deal registrations, revenue per enabled partner, and support escalation rates. That makes partner training impact visible and quantifiable, not just assumed.
At $50 per user per year, Pifini makes enterprise-grade training ROI measurement available to organizations that previously couldn't afford the analytics layer. Competitors like Seismic and Mindtickle charge $300–$600 per user annually, pricing out the mid-market teams that need ROI visibility most.
Frequently Asked Questions
What is a realistic ROI benchmark for sales training programs?
ROI varies widely by program quality, audience, and measurement approach. Well-designed programs can generate returns exceeding 150% when hidden ROI dimensions are included. Don't use industry averages as targets without establishing an internal baseline first.
How do you calculate sales training ROI without perfect data?
Three practical approaches work well when clean data is scarce:
- Use "contributed to" framing rather than direct attribution
- Apply conservative estimates for cost avoidance categories
- Compare cohorts (trained vs. untrained, or pre/post) as a proxy
What is the most overlooked hidden ROI of sales training?
Rep retention and ramp time are the most financially impactful hidden ROI drivers. Turnover costs alone (averaging $97,690 per sales rep) often exceed the entire annual training budget multiple times over.
How does sales training ROI differ for channel and partner sales teams?
Measure partner training ROI at the partner revenue level, deals closed, pipeline generated, and support escalations avoided, rather than individual rep metrics. Untrained partners create revenue loss and brand risk that each warrant separate quantification.
How long does it typically take to see ROI from a new sales training program?
Leading indicators (knowledge scores, coaching quality, certification rates) become visible within 30-60 days. Lagging revenue outcomes (ramp time, win rate, retention improvements) take 3-6 months to measure meaningfully.
What metrics should sales leaders track to capture hidden training ROI?
Establish these as baselines before any new program launches:
- Voluntary attrition rate
- Average time-to-quota
- Compliance incident rate
- Training score-to-win-rate correlation
- Partner revenue per enabled partner